Published June 28, 2016 • 3 Min Read
The infographic shows the average household expenditure and consumption from 2010 to 2014, and the median household income from 2010 to 2013 based on the most recent data from Statistics Canada.
Key takeaways:
1. The median household income is actually slightly lower than the average household expenditure from 2010 to 2013 (Statistics Canada doesn’t have numbers on the average household income). The average expenditure increased 9.7 percent from 2010 to $79,098, while the median income only rose 9.6 percent to $76,550 in the same period. The inflation during that period was 5.4 percent, suggesting both income and expenditure increased over time, and the majority, if not all of Canadian households’ income were used to cover their expenses.
2. In 2014, households spent an average of $59,057, or 73 percent of their total expenditures on goods and services. Housing costs ($17,160) make up a significant chunk of the expenditures, followed by transportation ($11,891), food ($8,109), household maintenance ($6,460), recreation ($3,843), clothing ($3,503), health and personal care ($3,458), others ($3,130) and education ($1,502). Income taxes ($14,867), personal insurance payments and pension contribution ($4,871), and charitable contributions ($1,934) make up the remainder 27 percent of the total expenditures.
3. Education expenses have increased by 30.4 percent from 2010 to 2014 as a result of a series of increases in nation-wide tuition fees. Families with kids entering university soon should be prepared to allocate more money towards education.
4. Households are putting more money into retirement and pension fund payments, which has shot up by 21.3 percent from $2,910 in 2010 to $3,531 in 2014. More Canadians putting money into their retirement is definitely good news. But for families with less income, that might mean you have to save more in other areas in order to afford that.
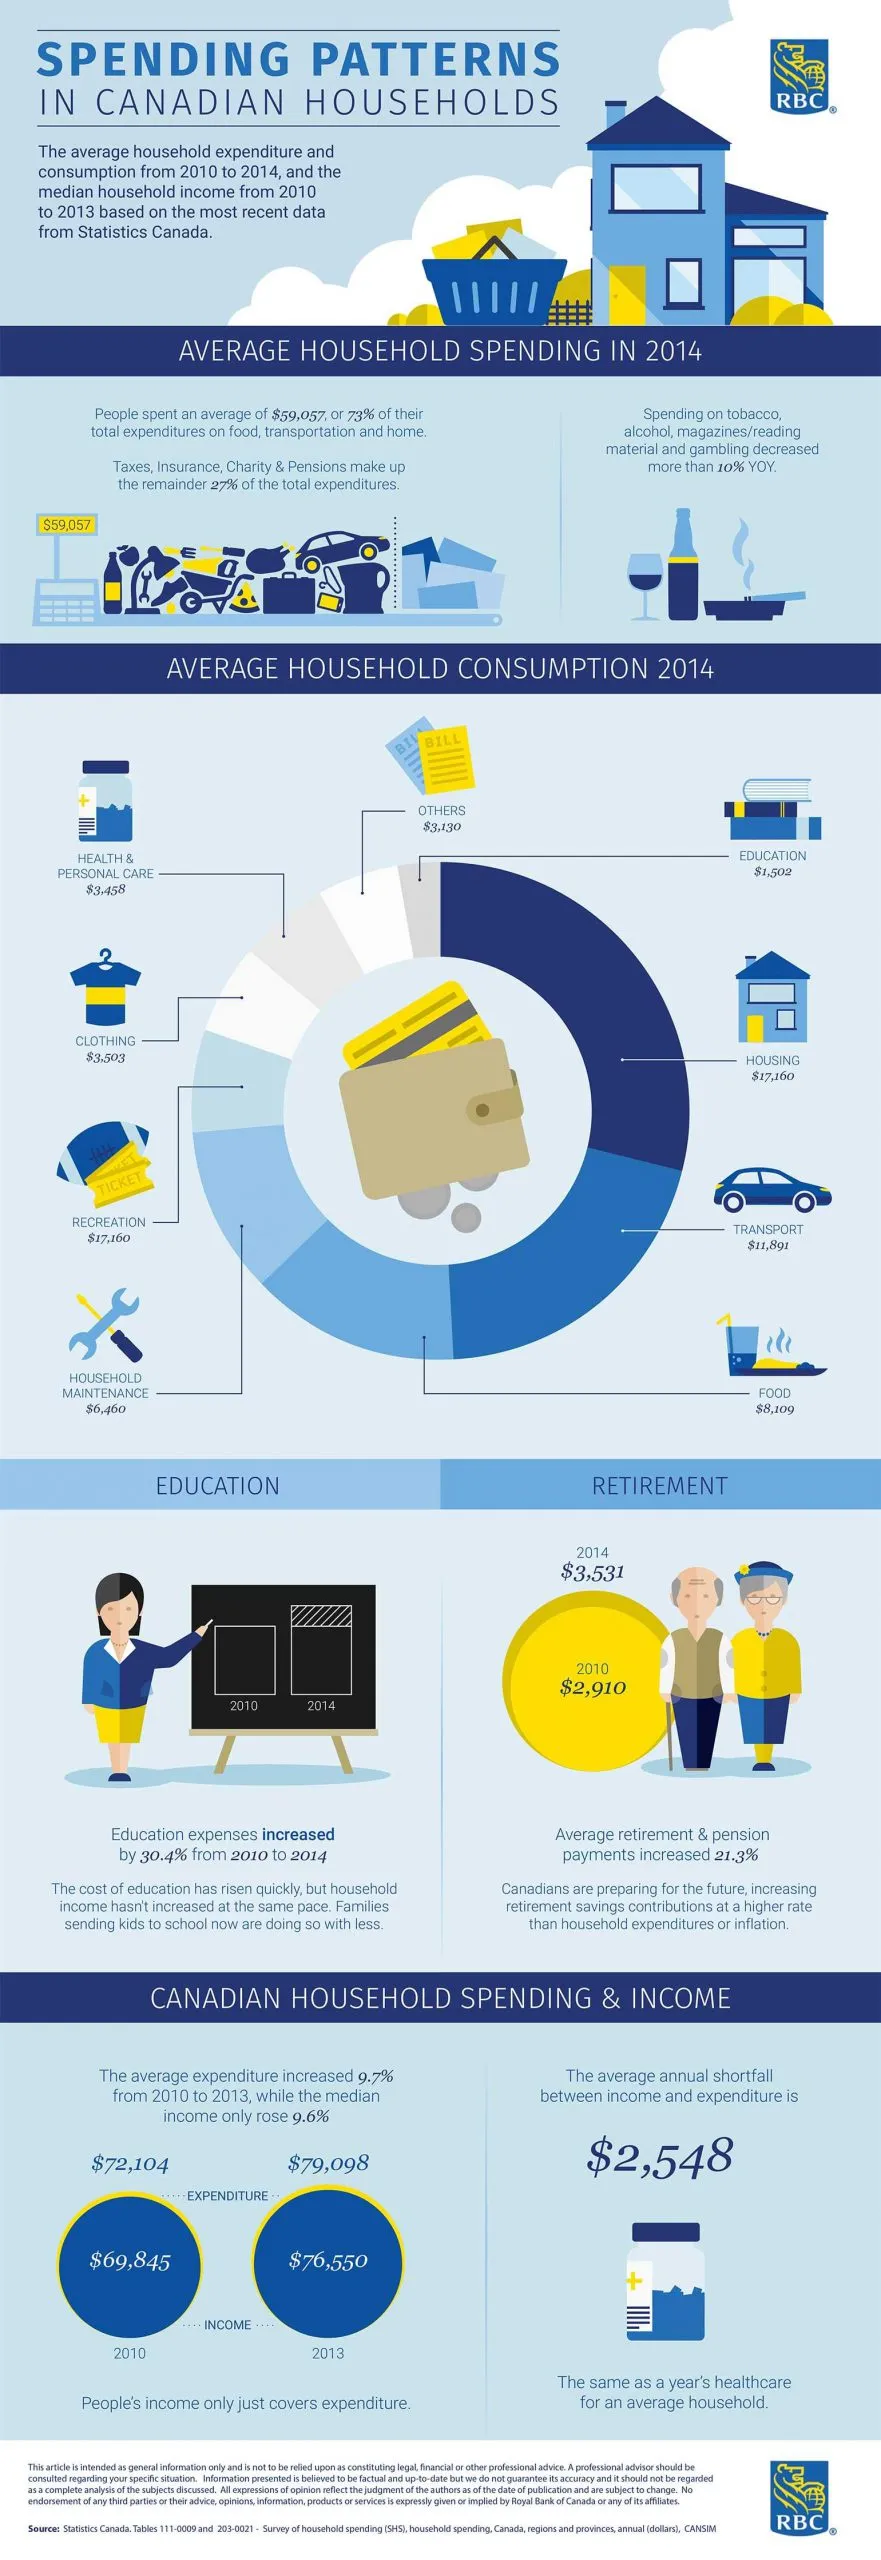
SPENDING PATTERNS IN CANADIAN HOUSEHOLDS
The average household expenditure and consumption from 2010 to 2014, and the median household income from 2010 to 2013 based on the most recent data from Statistics Canada.
Average household spending in 2014:
People in households spend an average of $59,057, or 73% of their total expenditures on food, transportation and home.
Taxes, insurance, Charity & Pensions make up the remainder 27% of the total expenditures.
Spending on tobacco, alcohol, magazines/reading material and gambling decreased more than 10% YOY.
Average Household Consumption 2014
• Health & Personal Care – $3,458
• Clothing – $3,503
• Recreation – $17,160
• Household Maintenance – $6,460
• Education – $1,502
• Housing – $17,160
• Transport – $11,891
• Food – $8,109
Education:
Education expenses increased by 30.4% from 2010 to 2014
The cost of education has risen quickly, but household income hasn’t increased at the same pace. Families sending kids to school now are doing so with less.
Retirement:
Average retirement & pension payments increased 21.3%.
Canadians are preparing for the future, increasing retirement savings contributions at a higher rate than household expenditures or inflation.
Canadian Household Spending & Income:
The average expenditure increased 9.7% from 2010 to $79,098 in 2013, while the median income only rose 9.6% to $76,550 in the same period.
People’s income only just covers expenditure.
The average annual shortfall between income and shortfall between income and expenditure is $2,548.
The same as a year’s healthcare for an average household.
This article is intended as general information only and is not to be relied upon as constituting legal, financial or other professional advice. A professional advisor should be consulted regarding your specific situation. Information presented is believed to be factual and up-to-date but we do not guarantee its accuracy and it should not be regarded as a complete analysis of the subjects discussed. All expressions of opinion reflect the judgment of the authors as of the date of publication and are subject to change. No endorsement of any third parties or their advice, opinions, information, products or services is expressly given or implied by Royal Bank of Canada or any of its affiliates.
Share This Article